Ocean Freight Rates Fall as Demand Declines
Global trade is absorbing the effects of inflation and weaker consumer demand as ocean freight rates sink more than 70% compared with a year earlier. The shipping cost to the US west coast from China has slumped, a sharp contrast to just a few months ago when terminals were scrambling to discharge and gate-out as many containers as possible.
The Shanghai Export Containerized Freight Index (SCFI) fell to 2,072.04 points on September 23, according to the China Securities Journal. This marks a 10.4% decrease week-over-week and about 60% lower than the beginning of the year. The cost of a 40-foot equivalent unit container from Shanghai to the west coast of North America dropped to $2,684, down 70% from the beginning of 2022. For a 20-foot container from Shanghai to Europe, the cost has dropped to $3,163, down 60% from the start of the year. Orders from Europe and the US from China are down more than 50% so far, according to the Yiwu exporter. Some expect the declining momentum to bleed into next year.
Shipping rates started to fall in July as the market was hit by declining demand in both European and United States markets due to rising inflation. Global growth is projected to remain moderate in the second half of 2022 and slow further in 2023 with an annual growth rate of 2.2% according to the Organization for Economic Cooperation and Development (OECD). The OECD raised China’s economic growth outlook to 4.7% next year from 3.2% this year.
Heightened demand for storage space remains, with an average warehouse vacancy rate of 3.4%. In some major ocean cargo gateways, there is hardly any free space. In Savannah, the rate is 0.1%. The high demand has left average rates over 9% higher from last year.
A Q&A with Paul Brashier, VP of Drayage and Intermodal
Paul Brashier has been an industry leader in the sales and logistics industry for over 20 years, working for such companies as Schneider National, Coors Brewing, and Coca-Cola. Joining ITS Logistics in 2015, Brashier created and elevated the drayage and intermodal division to #11 in the United States to over $300 million in revenue. Having been featured in the Wall Street Journal, MarketWatch, Bloomberg, The Loadstar, CBS News, Freight Waves, and Transport Topics, Brashier lends his expertise on US and global supply chain matters. When he isn’t working, which is rare, he spends time at his ranch with his wife and family, travels, and volunteers for the Down Syndrome Network of Northern Nevada.
What was the state of the global supply chain when rates were skyrocketing in 2021 and the first half of 2022?
Ocean freight rates were at record highs, some tariffs jumping as much as 200%. That was because the demand for containers reached such a high level and there was only a static amount of supply. On the trucking side, capacity was maxed out and that lack of additional supply started a bidding war for who could get the freight out of the terminals. Those BCOs that were willing to pay greater costs won and had their freight moved. In addition, cost was driven up from a lack of storage and chassis, as well as per diem fees, grounding operations, port detention and demurrage fees. All these charges contributed to rate hikes. Outside of ocean tariffs and dray linehaul, those ancillary charges are the ones that will break your budget.
Have you noticed any effects on drayage and warehouse capacity rates with the decline of ocean freight rates?
There are two factors that will drive down drayage rates: the first being available driver capacity and the second being terminal efficiency. With demand being low, there are just more drivers available which lowers rates for drayage. With terminal efficiencies gained over the past two years, drivers are processing upwards of five containers a day when before they were only doing one per day or one every other day because of the massive congestion.
Because of the significant inventory that BCOs have in their warehouses right now, they are looking to bring on additional 3PL space. The need for additional 3PL space is significantly increasing the cost for that space because it is difficult to bring new warehousing space online quickly.
How is port congestion on the west coast vs. the east coast?
We could see peak ocean freight volumes completely absorbed in Q4 by mid to end of October. As it stands now, Q4 projections are for pre-Q4 2018 congestion at ports throughout the US for the most part as we head into the holiday months. Some exceptions in October might be the Ports of New York and New Jersey as well as the Port of Savannah. Those ports have higher vessel congestion but have countered that by working the vessels so that container volumes do not outstrip the surrounding infrastructure to absorb the containers into the supply chain. To add, the Port of Houston is seeing higher inbound volumes, a chassis imbalance, and terminal congestion above normal levels.
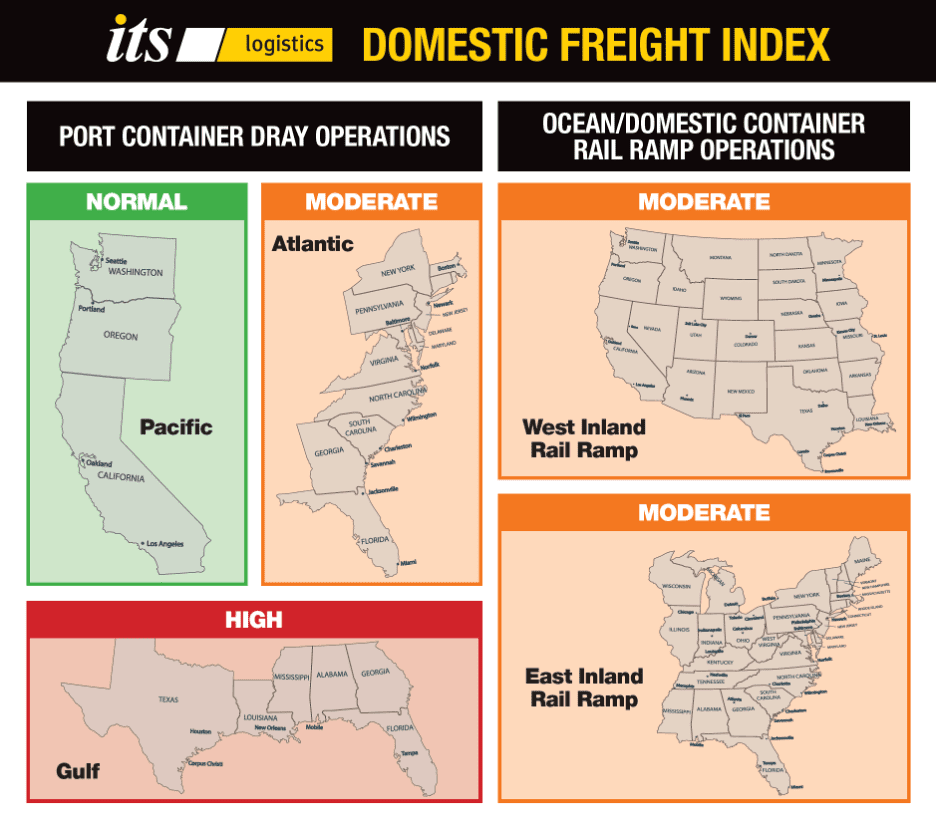
Empty container termination is still a significant challenge in New York and New Jersey, which is affecting available chassis and container storage. West coast labor disruption probability is low currently as both sides continue to negotiate in good faith. Opportunities for vessel bookings are optimal to Los Angeles and Long Beach if the labor stability continues to hold, and drayage capacity is underutilized. Spot market ocean container and inland dray rates will continue to push downward. Overflow oceanside transload capacity is readily available, especially on the west coast. We can also expect seasonal domestic truckload pricing to inch up as peak shipping season starts from October through January. Ideally, we should be in a good spot by the end of this year with a balanced market.
Have there been more drayage inquiries due to rail delays?
Rail transportation is still experiencing a large backlog on the west coast, especially IPI transfer freight from the terminals to the rail ramps. For example, from container arrival in LA to the Chicago Ramp, the transit time is upwards of 25 days, from the normal 7-10 days. To avoid that delay, our clients are grabbing that freight at the port prior to transfer then transloading and shipping via domestic truckload to their DCs further inland. Inland rail ramps will become severely challenged as congestion increases and chassis pools are depleted from IPI containers moving from the west coast inland.
What are some common pain points amidst your clientele?
Many of our clients DCs are overstocked and they are navigating how to deal with that excess inventory and move all the subsequent freight. With that headwind, those DCs that process their import freight are really feeling the pressure. ITS creates nimble, tailormade solutions. As a multi-mode transportation provider in North America, we can easily create operations to identify high demand SKUs, take them from the terminals to our pop-up transload facilities, and send our 53-foot domestic fleet to inject that inventory further inland. By getting the inventory to the DCs that much more quickly, the consumer can in turn get their products in hand at the right time.
How can US companies fortify their supply chains to resist global disruptions?
Here are my recommendations:
- Diversify your distribution center locations. Having operations at just one hub won’t work in today’s Age of Disruption. At a minimum, operations should be on both east and west coasts. From my experience in the industry, we have seen the most success with four DC networks.
- A challenge I see in the supply chain right now is that the coastal DCs that process ocean containers are overwhelmed. Successful supply chain leaders are cross docking close to the terminal outside of those overwhelmed DCs so that the containers can be transported via truckload further inland.
- Work with providers that have a large footprint and are flexible and scalable. As containers are routed to new terminals throughout North America, having a provider that has operations in those new areas makes the transition seamless.
- For those BCOs that signed ocean and drayage contracts at the all-time high rates in Q1 2022, engaging a trusted partner like ITS to check current dray rates will greatly reduce transportation costs. If possible, engage in RFP activity now.
Managing drayage and distribution with a trusted logistics partner
By looking down the supply chain, there are strategies to avoid or minimize the impact from disruptions. With a footprint of 33 markets in North America, ITS offers the flexibility to be your sole source of drayage options and distribution options despite changes within the supply chain. Our team can execute creative solutions from port to door.
ITS is currently ranked as the #11 Top Intermodal/Drayage Carriers and #71 Top Dry Storage Warehousing Firms in North America by Transport Topics.
How can we help you?
Related articles
News + resources
The Advantages of a 3PL That Handles Distribution, Fulfillment and Drayage
Blog | Distribution + Fulfillment
A full-service third-party logistics provider that handles all aspects of your distribution and fulfillment is beneficial for your business.
Labor Management and Scalability Add to Supply Chain Success
Blog | Distribution + Fulfillment
Labor management and scalability is critical to the movement of goods. Nearly every industry is struggling to find labor right now.
Are Your Inventory Management Strategies Changing?
Blog | Distribution + Fulfillment
Risks of just-in-time inventory are causing businesses to increase inventory to mitigate risk. Learn more on inventory management strategies.